class: center, middle, inverse, title-slide .title[ # CRT Data Visualisation<br/>Workshop ] .subtitle[ ## Day 2 ] .date[ ### July 2025 ] --- class: center, middle background-image: url(imgs/grid.png) background-size: cover # ggplot2 extensions --- ### ggrepel .left-code[ ``` r library(ggplot2) library(ggrepel) df <- data.frame(x = rnorm(10, 10, 5), y = rnorm(10,10,10), label = sample(LETTERS, 10)) ggplot(df, aes(x = x, y = y)) + geom_point() + * geom_text_repel(aes(label = label), size = 8) ``` ] .right-plot[ <img src="day2_files/figure-html/ggrepel-out-1.png" width="100%" /> ] --- ### ggtext .left-code[ ``` r library(ggtext) *df$label <- paste0("<span style='color:red'>", * df$label, * "</span>") ggplot(df, aes(x = x, y = y)) + * geom_richtext(aes(label = label), size = 10) ``` ] .right-plot[ <img src="day2_files/figure-html/ggtext-out-1.png" width="100%" /> ] --- ### ggforce .left-code[ ``` r library(ggforce) df <- data.frame(x = rep(c('A','B'), each = 100), y = c(rnorm(100, 10, 20), rnorm(100, 20, 5))) ggplot(df, aes(x = x, y = y)) + * geom_sina() + geom_violin(fill = 'transparent', draw_quantiles = 0.5) ``` ] .right-plot[ <img src="day2_files/figure-html/ggforce-out-1.png" width="100%" /> ] --- ### ggpubr .left-code[ ``` r library(ggpubr) ggplot(df, aes(x = x, y = y)) + geom_sina() + geom_violin(fill = 'transparent', draw_quantiles = 0.5) + * stat_compare_means( * comparisons = list(c('A','B')), size = 10) ``` ] .right-plot[ <img src="day2_files/figure-html/ggpubr-out-1.png" width="100%" /> ] --- ### ggfx .left-code[ ``` r library(ggfx) ggplot(df, aes(x = x, y = y)) + * with_blur(geom_jitter(), * sigma = unit(1, 'mm')) ``` ] .right-plot[ <img src="day2_files/figure-html/ggfx-out-1.png" width="100%" /> ] --- class: center, middle background-image: url(imgs/grid.png) background-size: cover # Other R packages & things you should know about --- ### UpSetR .left-code[ ``` r library(UpSetR) up_list <- list(A = sample(letters, 20), B = sample(letters, 10), C = sample(letters, 20), D = sample(letters, 5)) upset(fromList(up_list), text.scale = 2) ``` ] .right-plot[ <img src="day2_files/figure-html/UpSetR-out-1.png" width="100%" /> ] .doc-link[ [*UpSetR documentation*](https://github.com/hms-dbmi/UpSetR) ] --- ### ComplexHeatmap .left-code[ ``` r library(ComplexHeatmap) mat <- matrix(rnorm(1000,0,2), nrow = 50, dimnames = list(paste0('cell_', 1:50), paste0('gene', 1:20))) Heatmap(mat) ``` ] .right-plot[ <img src="day2_files/figure-html/ComplexHeatmap-out-1.png" width="100%" /> ] .doc-link[ [*ComplexHeatmap documentation*](https://jokergoo.github.io/ComplexHeatmap-reference/book/) ] --- ### circlize .left-code[ ``` r library(circlize) df <- data.frame(from = rep(LETTERS[1:4], times = 4), to = rep(LETTERS[1:4], each = 4), value = sample(1:100, 16)) chordDiagram(df) ``` ] .right-plot[ <img src="day2_files/figure-html/circlize1-out-1.png" width="100%" /> ] .doc-link[ [*circlize documentation*](https://jokergoo.github.io/circlize_book/book/) ] --- ### circlize .left-code-wide[ ``` r df <- generateRandomBed(200, species = "hg19") par(cex = 1.5) circos.initializeWithIdeogram(species = "hg19") circos.genomicTrack(df, panel.fun = function(region, value, ...){ circos.genomicPoints(region, value, ...) } ) ``` ] .right-plot-narrow[ <img src="day2_files/figure-html/circlize2-out-1.png" width="100%" /> ] .doc-link[ [*circlize documentation*](https://jokergoo.github.io/circlize_book/book/) ] --- ### karyoploteR .left-code-wide[ ``` r library(karyoploteR) df <- data.frame(chr = 'chr1', positions = runif(10, min = 0, max = 2.4e8)) kp <- plotKaryotype(plot.type = 2, chromosomes = c('chr1')) kpPlotMarkers(kp, chr = df$chr, x = df$positions, labels = NA, adjust.label.position = F) ``` ] .right-plot-narrow[ <img src="day2_files/figure-html/karyoploteR-out-1.png" width="100%" /> ] .doc-link[ [*karyoploteR documentation*](https://bernatgel.github.io/karyoploter_tutorial/) ] --- ### patchwork and cowplot ``` r library(patchwork) p1 <- ggplot(mpg, aes(x = hwy, y = displ)) + geom_point() p2 <- ggplot(mpg, aes(x = cty)) + geom_histogram() p1 + p2 + plot_annotation(tag_levels = 'A') ``` <img src="day2_files/figure-html/patch-cow1-1.png" width="100%" /> --- ### patchwork and cowplot ``` r library(cowplot) plot_list <- list(p1,p2) plot_grid(plotlist = plot_list, labels = 'AUTO') ``` <img src="day2_files/figure-html/patch-cow2-1.png" width="100%" /> --- ### Inkscape .center[  ] .doc-link[ [Inkscape website](https://inkscape.org/) ] --- ### Python packages .center[  ] --- ### Where to look for... Good advice .link-list[ - [Datawrapper blog](https://www.datawrapper.de/blog/category/datavis-dos-and-donts) - [Friends don't let friends make bad graphs](https://github.com/cxli233/FriendsDontLetFriends/tree/main) ] Inspiration .link-list[ - [R graph gallery](https://r-graph-gallery.com/) - [TidyTuesday](https://bsky.app/search?q=%23TidyTuesday) & [30DayChartChallenge](https://bsky.app/search?q=%2330DayChartChallenge) ] Pretty colour palettes .link-list[ - [Coolors.co](https://coolors.co/generate) ] --- class: center, middle background-image: url(imgs/grid.png) background-size: cover # ✨ Plot makeover challenge ✨ --- ### Plot makeover challenge Before... .center[ 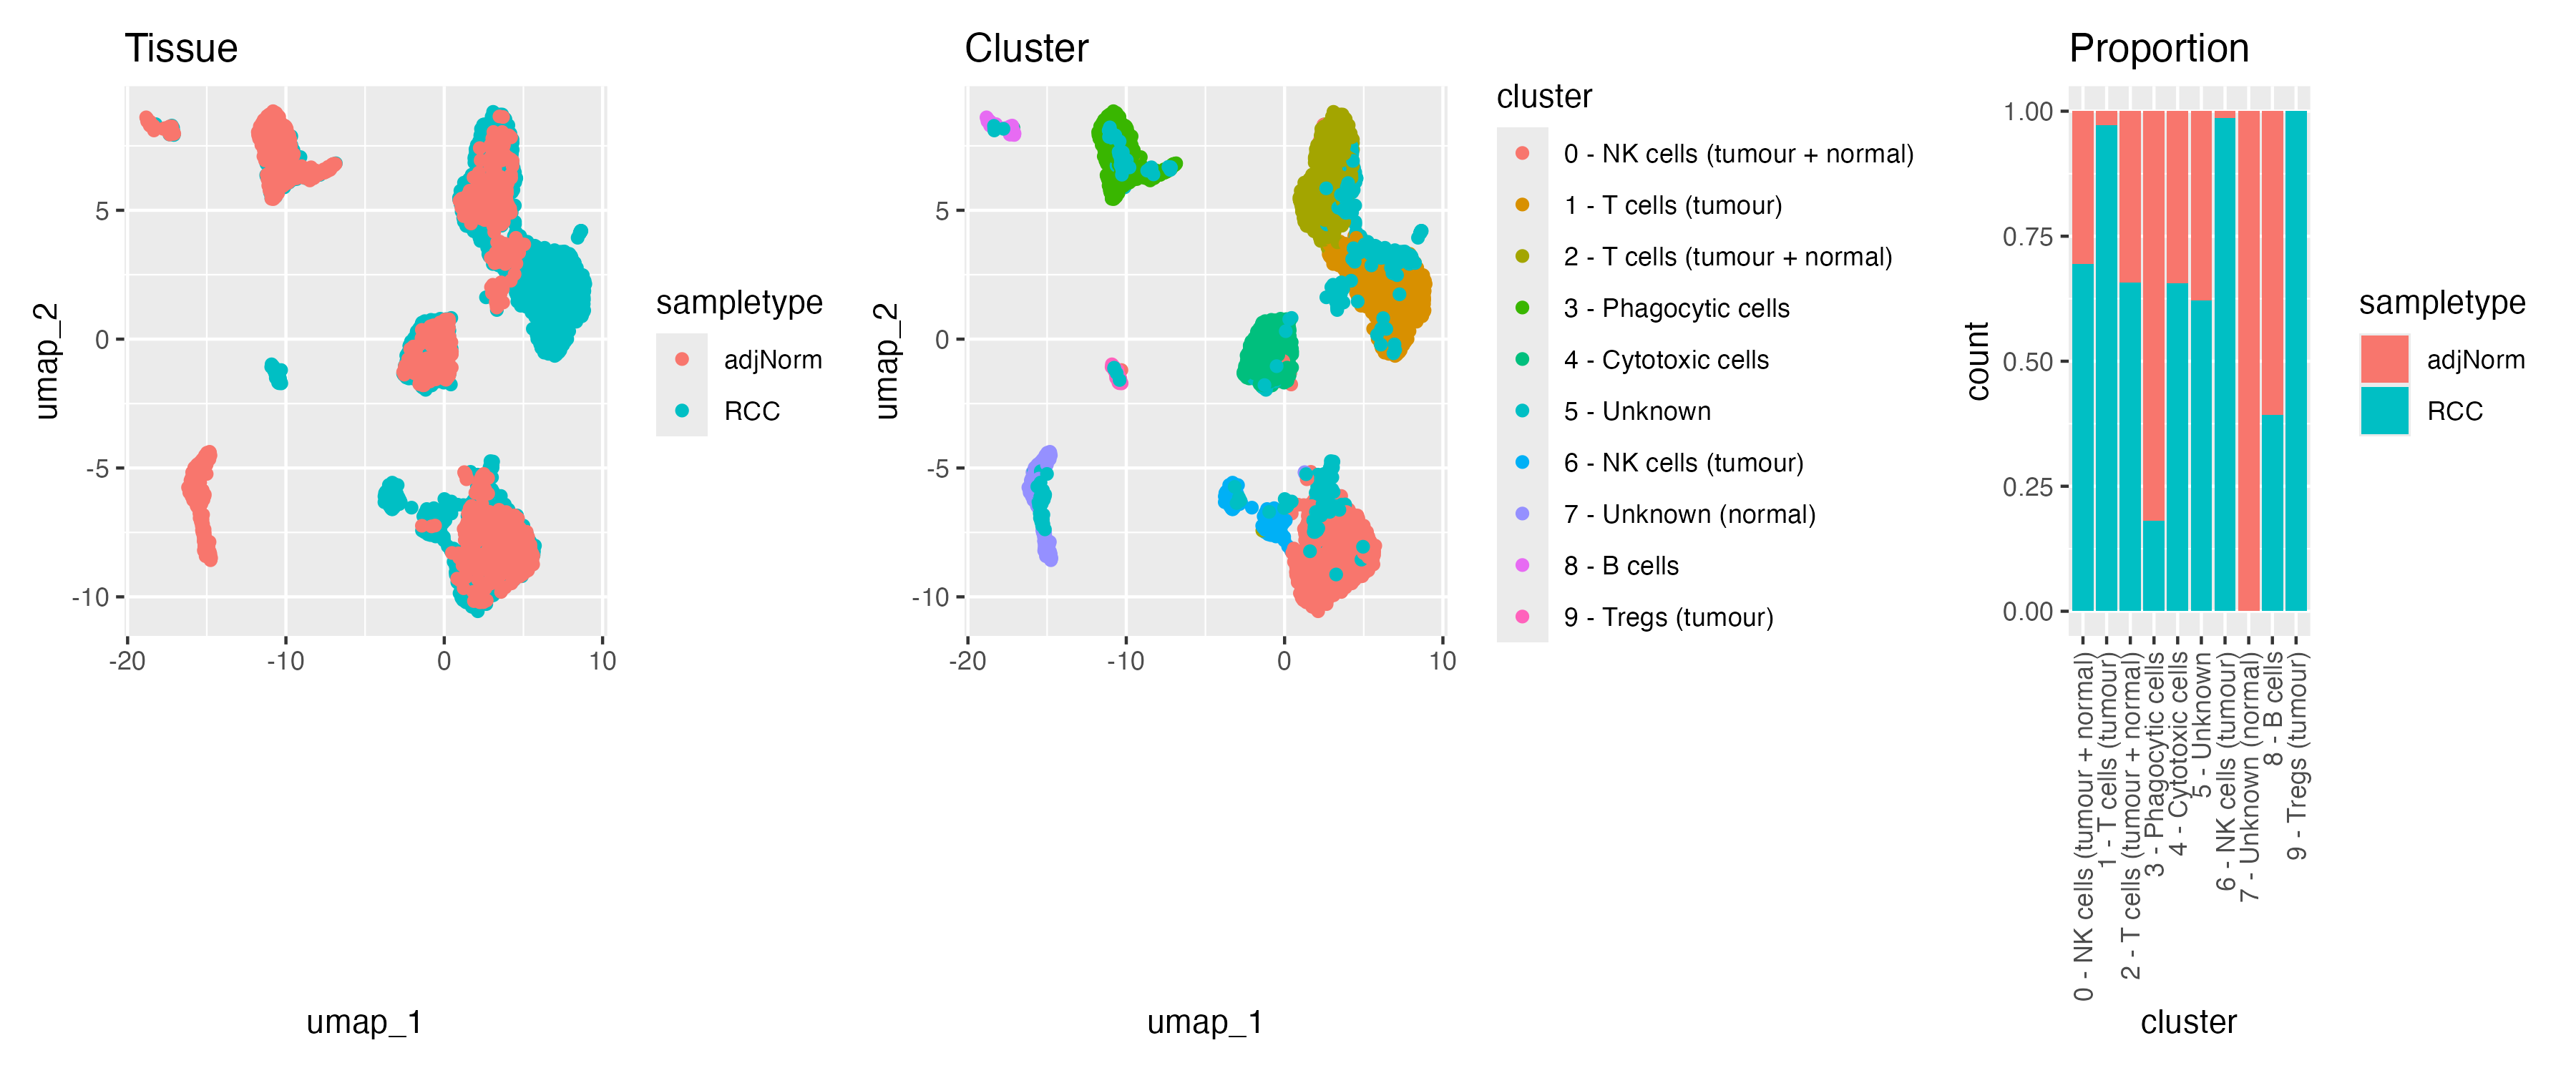 ] --- ### Plot makeover challenge ...After .center[ 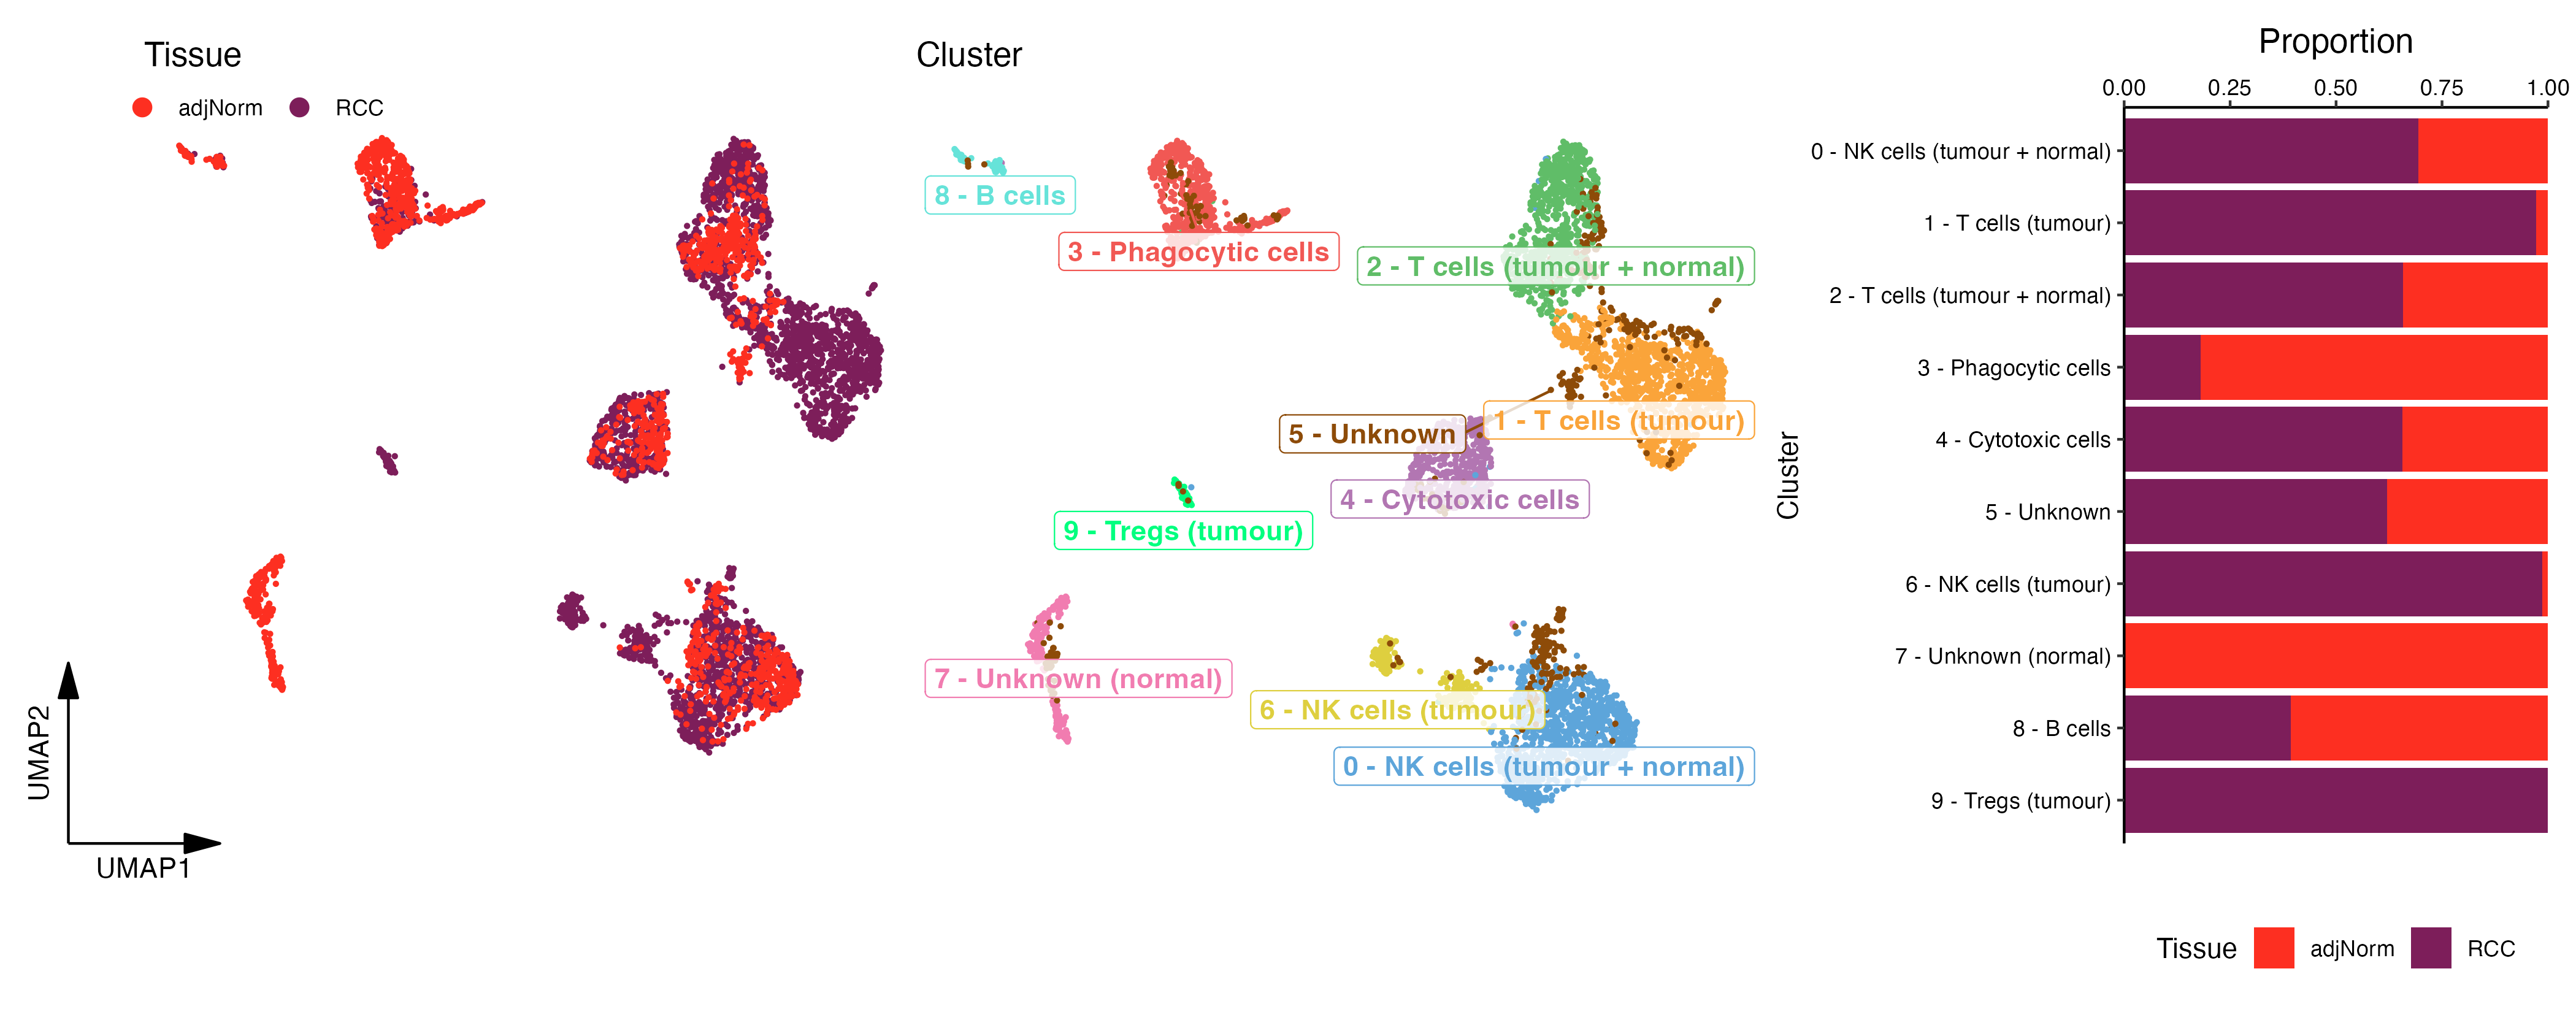 ]